

Visualizations
The 25 chart types Bhoral can draw, and how it suggests the right one.
The Visualizations gallery shows the charts Bhoral can draw. Every example uses sample data written for the gallery, never your data.
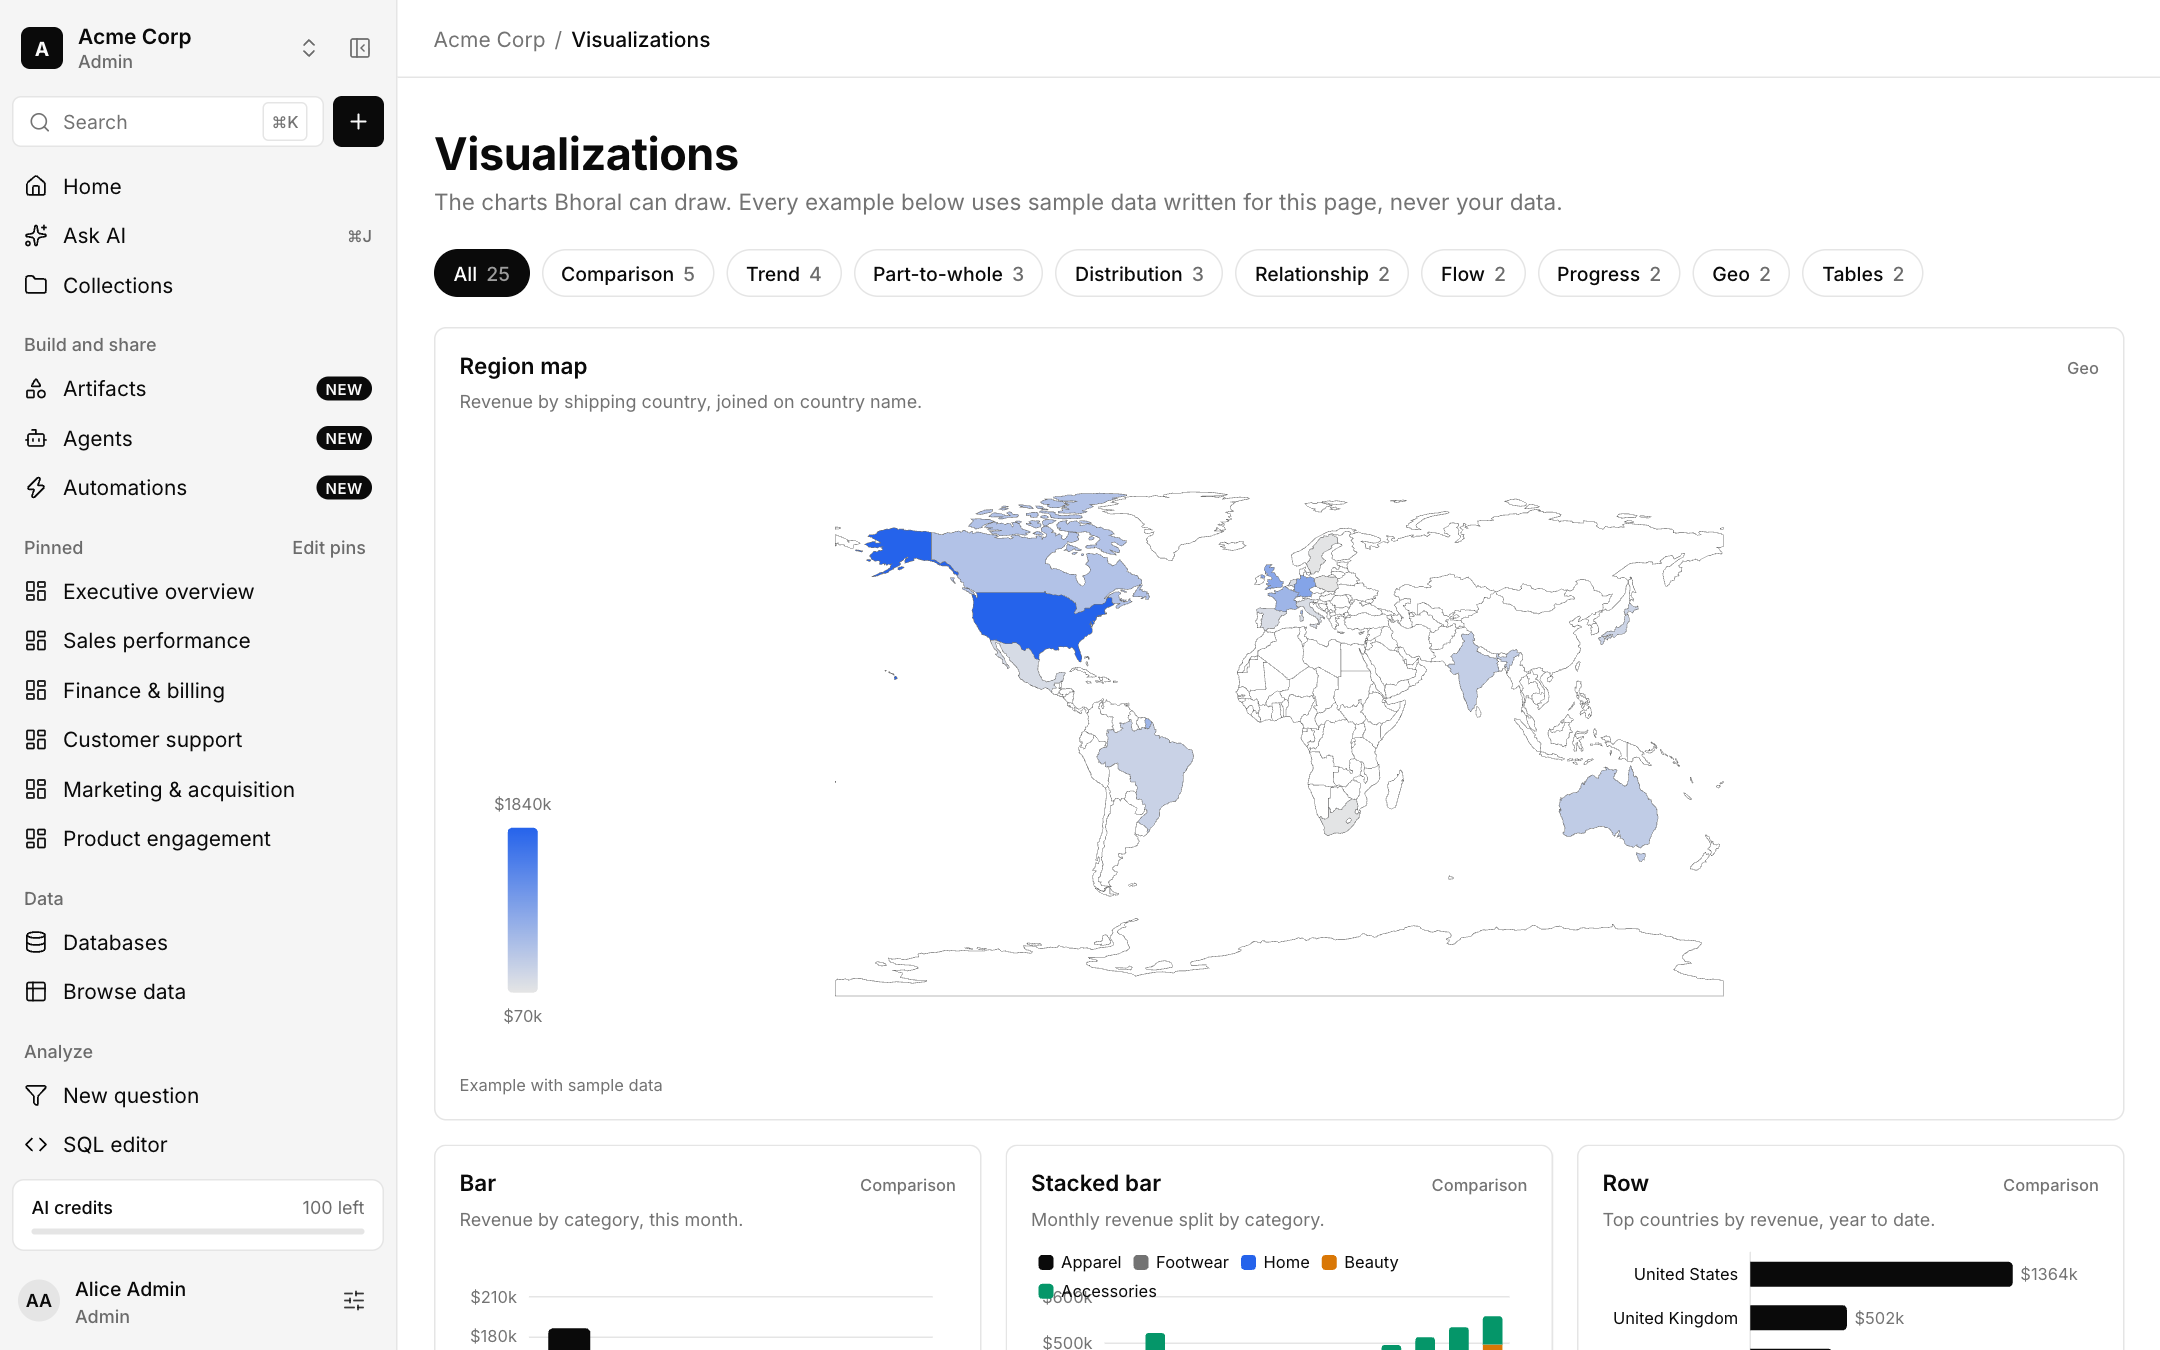
Chart types
| Group | Charts |
|---|---|
| Comparison | Bar, stacked bar, row, waterfall, radar |
| Trend | Line, area, combo, calendar heatmap |
| Part-to-whole | Donut, treemap, sunburst |
| Distribution | Histogram, box plot, heatmap |
| Relationship | Scatter, bubble |
| Flow | Funnel, Sankey |
| Progress | Gauge, number with trend |
| Geo | Region map, pin map |
| Tables | Formatted table with inline bars and conditional colour, and pivot |
Picking the right chart
When you run a query or build a question, Bhoral recommends charts from the shape of the data, such as a time column and a measure, and gives a reason for each suggestion. You can always pick another from the Visualize bar.